A small Foot and Mouth Disease outbreak, controlled in 3 months, could cost Australia around $7.1 billion, while a large 12-month outbreak would cost $16 billion.
Deer were brought to Australia for hunting and farming in the 1800s.
Over time feral populations established, but until recently their impacts were not widely recognised.
Today the extensive population growth poses threats to Australia’s primary production, environment and communities.
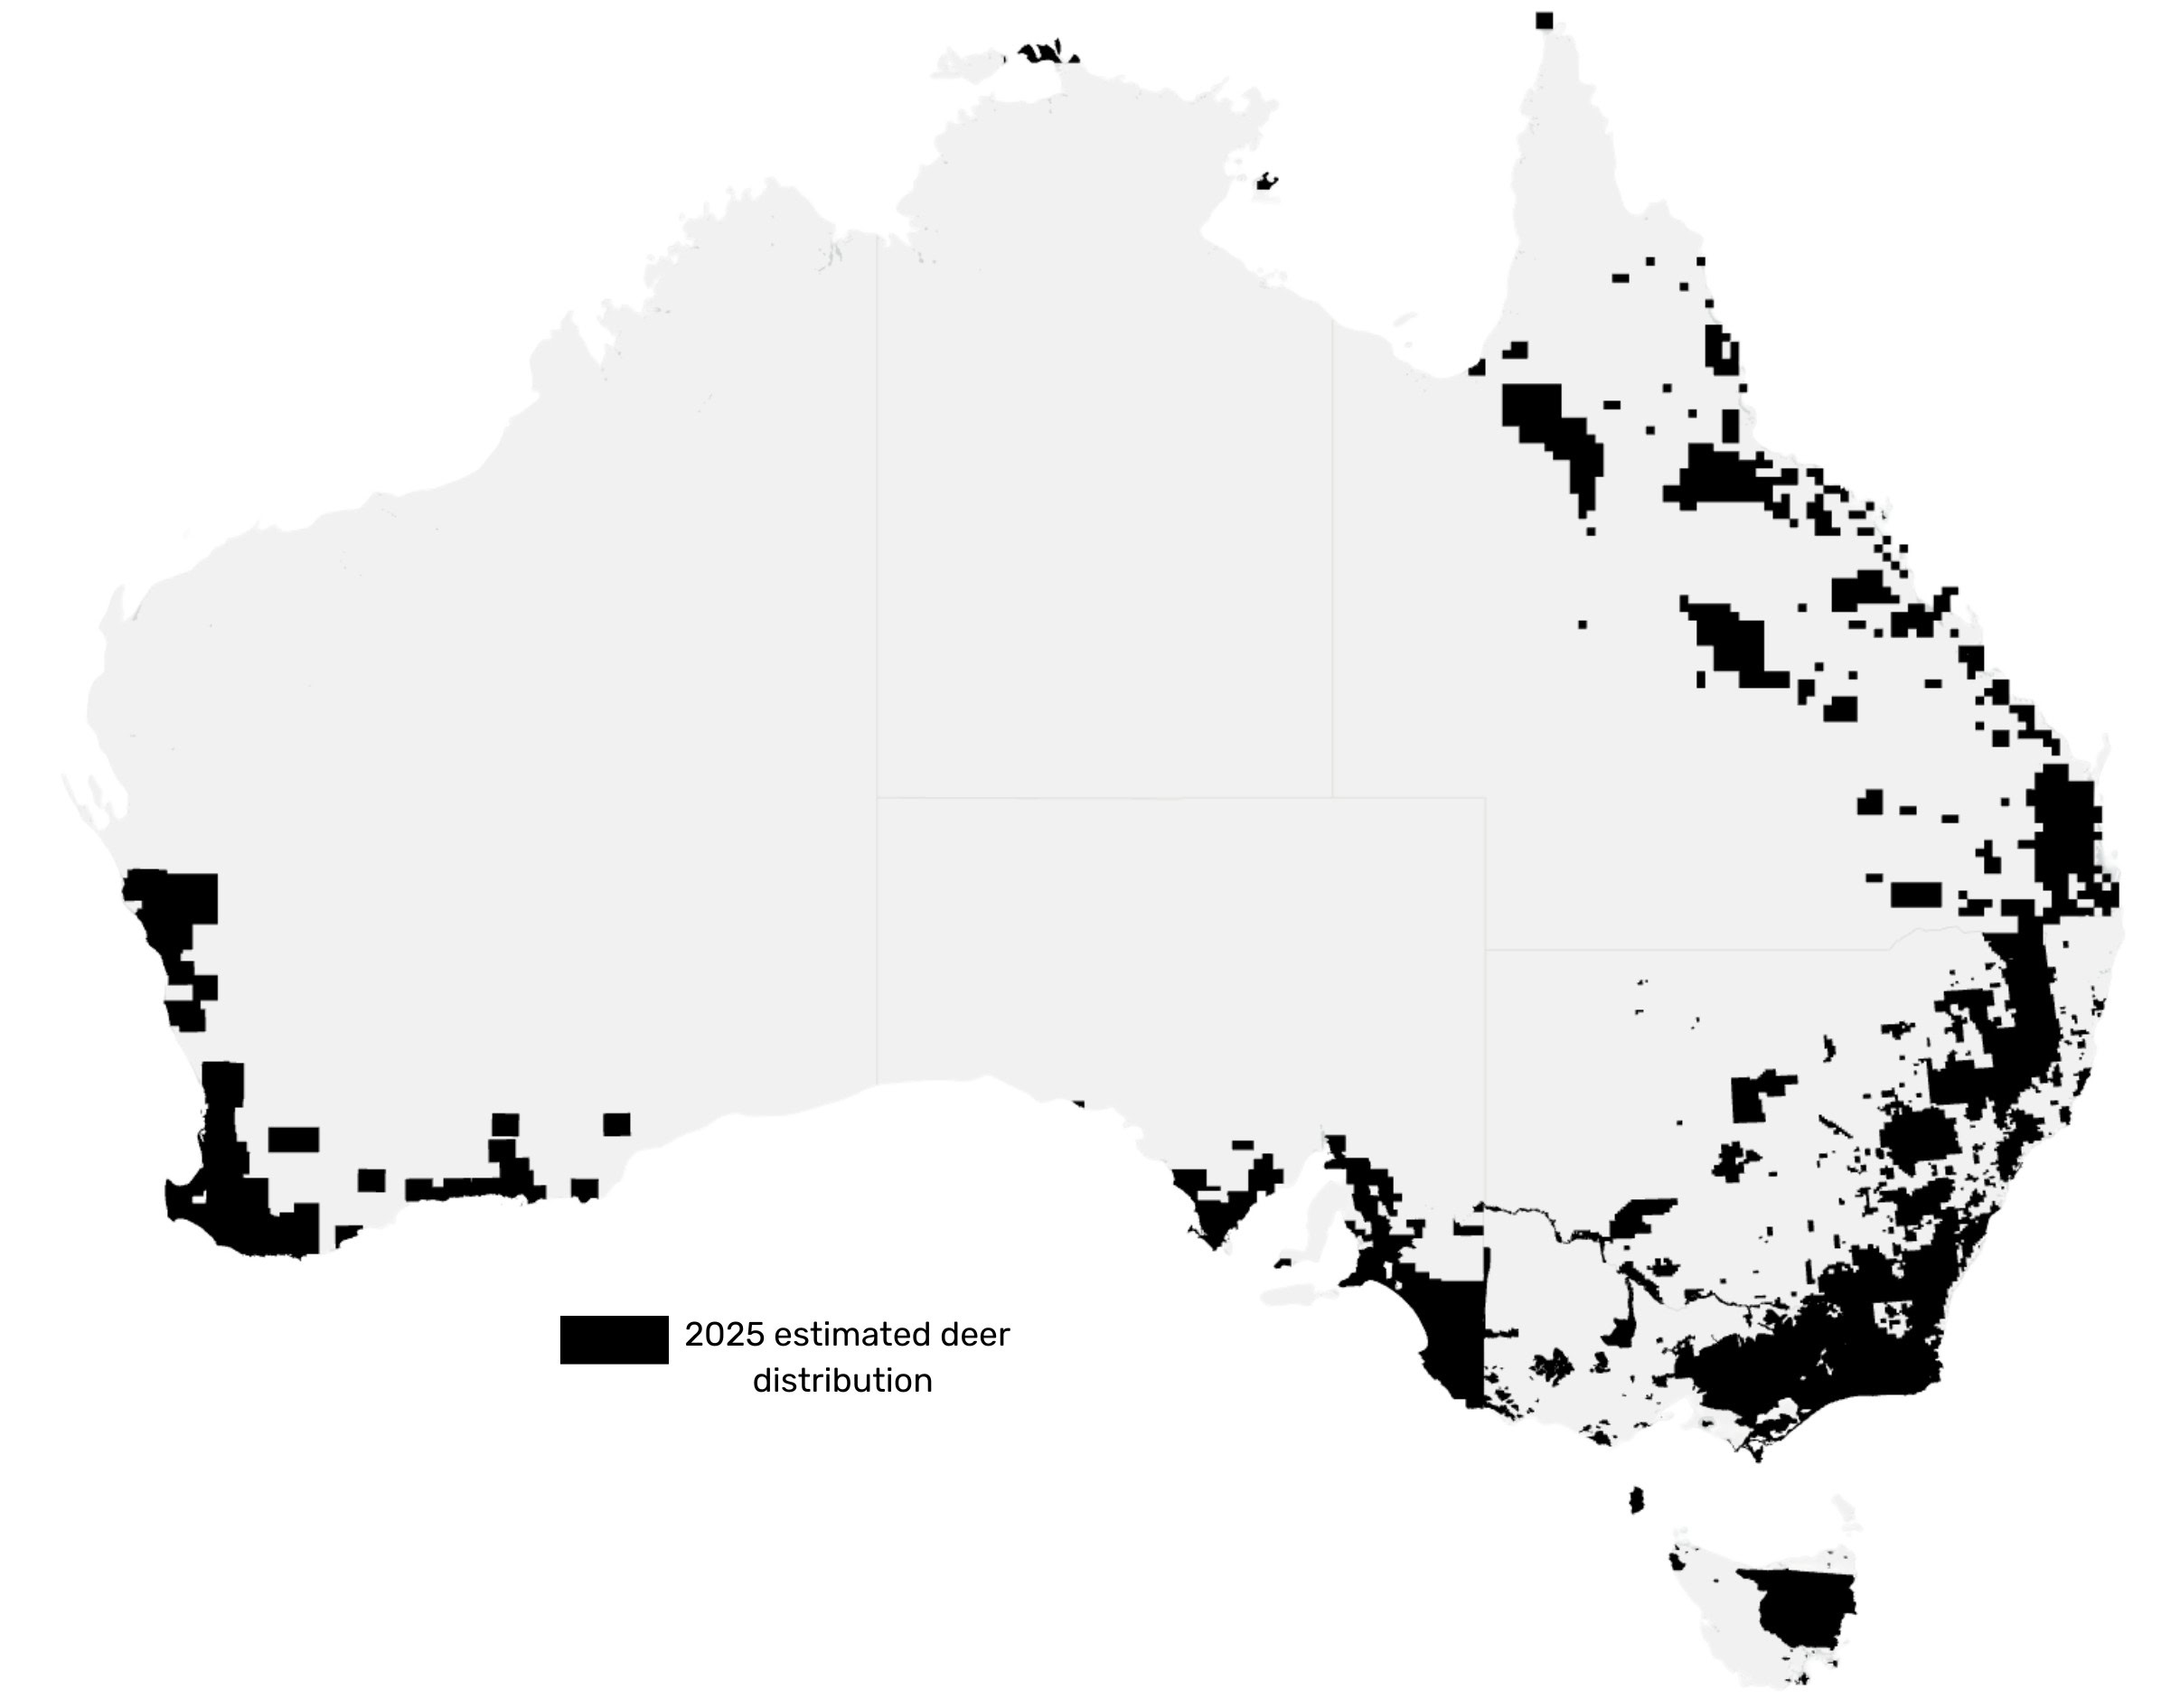
2025 Feral Deer Distribution
Predictive models, based on habitat requirements of feral deer, indicate that one or more deer species could spread to most parts of Australia.
Our challenge is to stop the current spread of feral deer.
How many feral deer need to be removed each year to reduce impacts in the area?
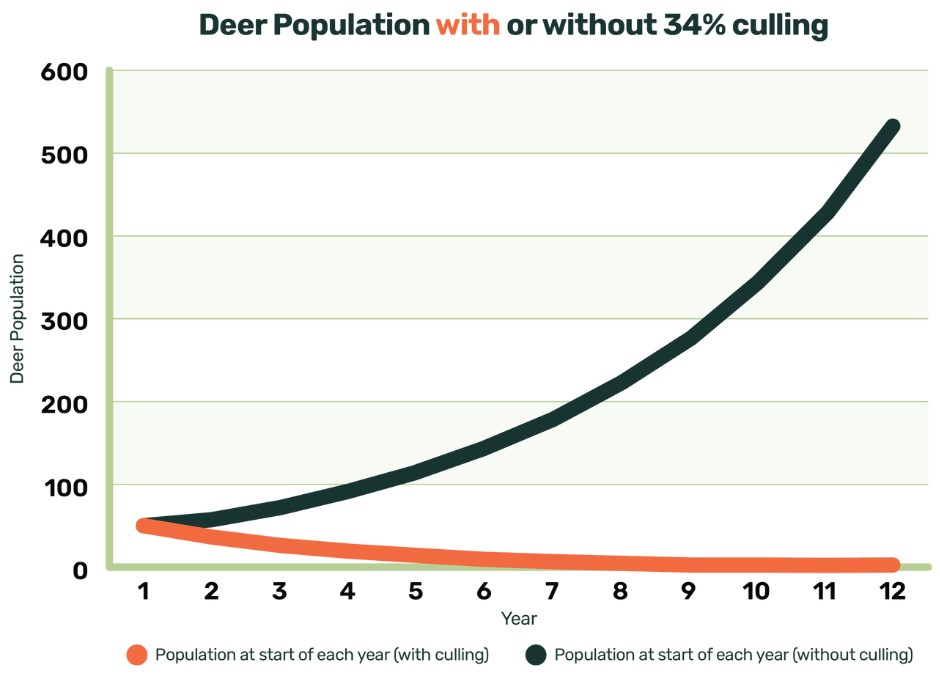
The population of feral deer in Australia is uncertain, but estimates range from one to two million, and the numbers are on the rise. In the absence of culling and under favourable conditions, feral deer populations can surge by 34 to 50 percent annually. Without intervention, a modest herd of 30 deer can expand to 500 in a decade.
Intensive culling, exemplified by recreational hunting in Tasmania, has proven effective in moderating deer population growth, maintaining an average rate of about 5 percent per year. This rate translates to a doubling of the population every 15 years.
Another challenge in protecting Australia’s assets involves preventing the escalation of existing deer populations. Due to the boundary-crossing behaviour of feral deer, collaborative efforts among neighbours and communities are crucial for coordinated actions. To curb natural population growth, communities should implement best practices, targeting an annual reduction of at least 35% in feral deer populations.
In terms of deer control strategies, the most efficient and cost-effective approach is when deer populations are low. Eradication is viable in areas with small, isolated numbers. However, as feral deer numbers increase and spread, the costs of managing and containing them escalate over the long term.
Modelling data from Hone et al (2010) estimates that, under favourable conditions, the following proportions of the local deer population need to be removed to halt population growth:
34% for Fallow deer
40% for Sambar deer
49% for Chital
46% for Rusa
Hone. J, Duncan. R and Forsyth. D (2010) Estimates of maximum annual population growth rates of mammals and their application in wildlife management. Journal of Applied Ecology, 47, 507-514
Listen to the podcast Towards a Feral Free Future : Oh deer! We have a problem here. Produced by the Centre for Invasive Species Solutions.
This graph illustrates the potential growth of a fallow deer population under favourable conditions, with and without an annual culling rate of 34%.
*Assumptions of the graphed model
50% population is female (at beginning)
80% of the females are adult
80% of the adult females reproduce 1 fawn
50% fawns each year are female
cull rate is 34% and natural 6% attrition
assume 50% female and 50% males culled
Impacts to Agriculture
Feral deer are costing land managers on average $2,018 per year per property for control activities (ABARES dashboard, 2022). They cause significant economic, environmental and social impacts through damaging crops, pastures, saplings, and infrastructure, while posing a biosecurity risk through disease transmission to livestock. They are also emerging as pests in backyard gardens, especially in peri-urban areas.
Fast Fact: How much of my pasture does a deer eat?
A fallow deer eats 1.8 to 2.3 times as much as a sheep (Dry Sheep Equivalent). A red or rusa deer eats 2.8 to 3.6 times as much as a sheep.
Fast Fact:
Fallow deer in Tasmania cost the state’s agricultural industry at least
$10 million annually.
Biosecurity Risk
Feral deer pose a biosecurity risk through the transmission of diseases and parasites to livestock. Biosecurity risks include Brucellosis, Bovine Tuberculosis, Johne’s disease, Cattle tick, Leptospirosis and Foot and Mouth Disease (not currently in Australia).
In other countries, Foot and Mouth Disease outbreaks result in export bans on livestock products, and low market prices. Containing such outbreaks in feral deer populations is difficult and expensive.
Fast Fact:
A small Foot and Mouth Disease outbreak, controlled in 3 months, could cost Australia around $7.1 billion, while a large 12-month outbreak would cost $16 billion.
Cow with Johne's Disease
Impacts to the Environment
Deer damaging wetlands
Feral deer pose a threat to biodiversity and ecosystems, affecting National Parks, Reserves, and heritage-listed rainforest areas. Their profound impact includes browsing on young trees, ringbarking mature trees, spreading weeds, and trampling waterways, altering the structure and composition of vegetation, especially native flora.
In New South Wales, the environmental impacts of deer are recognised as a key threatening process under the State’s Threatened Species Act 1995.
Fast Fact:
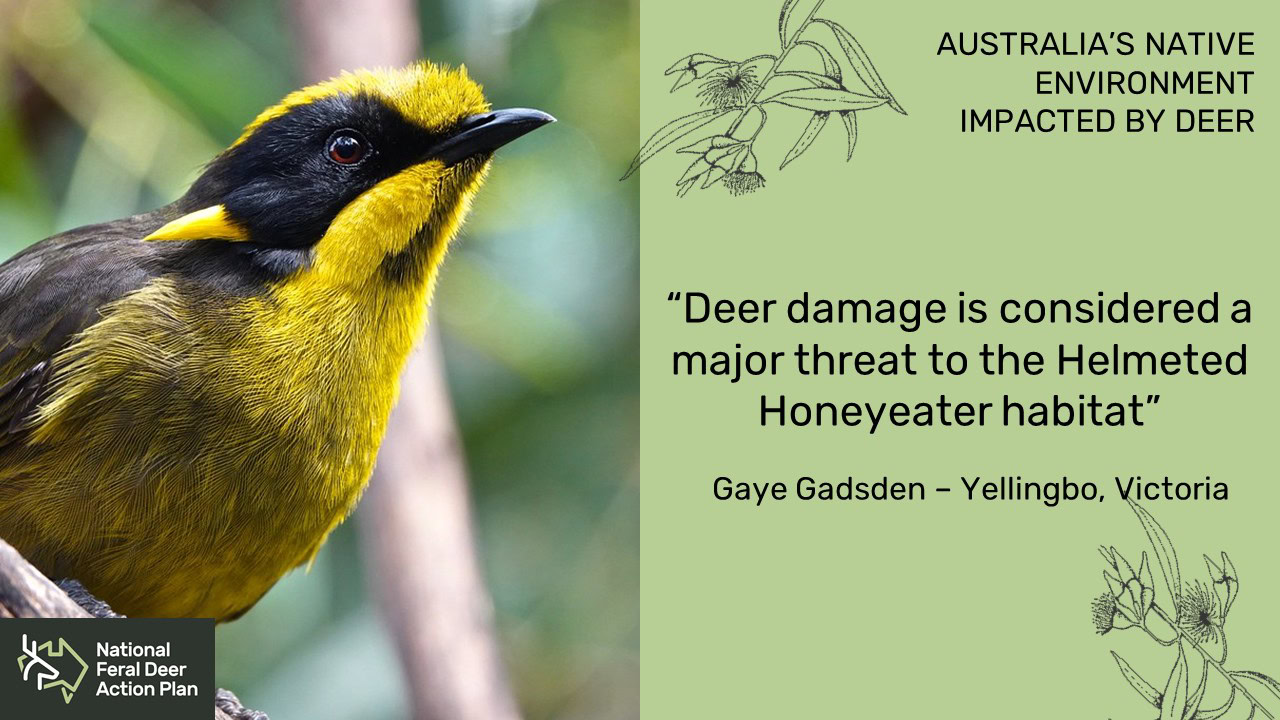
In Victoria, Sambar are listed as a potentially threatening process to native vegetation, including threatened Alpine Sphagnum Bog communities. The Victorian Deer Control Strategy 2021 suggests that over a thousand native plant and animal species would benefit from deer control efforts across the state.
Two sisters discuss impacts of feral deer: A chat between two sisters in two states, one living with the effects of an established feral deer population, the other curious as to how the coming migration of deer into the Border Ranges NSW, will affect her rural lifestyle (they’re here already, actually, so listen up. Yes, you!).
Feral deer impacts are now occurring in areas where they are native. Watch the below video to learn about how the reduction of feral deer impacts in Yellowstone National Park not just transformed the ecosystem but also its physical geography.
“The only way that Parks Victoria and Friends of Helmeted Honeyeater can create new habitat for the helmeted honeyeater is to surround that vegetation with expensive deer exclusion fencing”
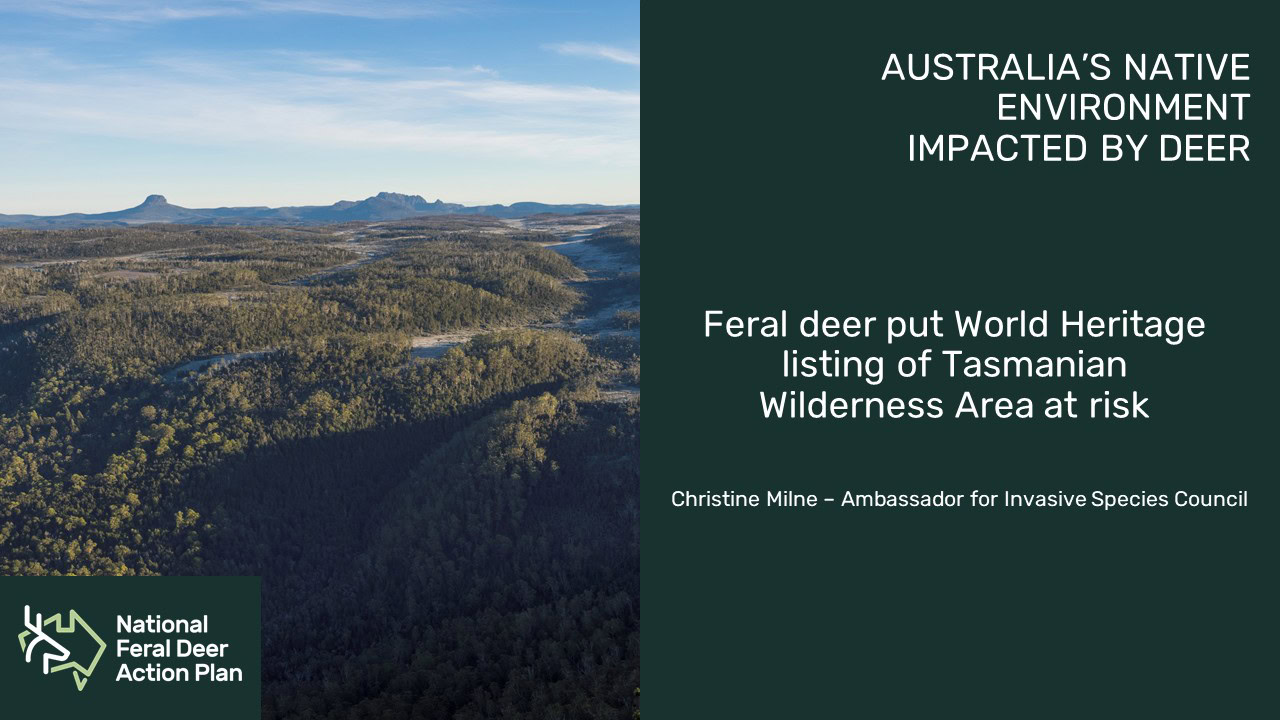
“In order to be Wold Heritage you have to maintain the natural and cultural values for which you are listed and feral deer put that at risk because what they’re doing is undermining some of the specific criteria for which World Heritage was granted.”
– Christine Milne – Ambassador for Invasive Species Council
Feral deer significantly hinder bushfire recovery by directly impacting regeneration success. Their hard hooves pose a trampling threat to the vulnerable post-bushfire environment, and they graze on emerging saplings, hindering their establishment and ringbarking remaining trees.
Secondly, post-bushfires, feral deer populations escalate in size and spread, intensifying pressure on the recovering land. After the 1994 Royal National Park bushfires, local deer densities surged from <500 to 2500 in 1999, fuelled by the abundance of nutritious saplings. Increased density is facilitated by the need to move into unburnt areas, gaining access to previously impenetrable land.
A map illustrates the overlap of feral deer distributions with or near bushland regenerating from the 2019-2020 bushfires. Beyond directly impeding natural bushfire recovery, feral deer significantly hinder regeneration efforts.
“There is absolutely no point being involved in bushcare recovery if you can’t also protect the forest from the deer” – Kieran Tapsell
To mitigate herbivory pressure on restored forests, protective guards for individual plants or exclusion fences around planted seedlings are commonly used. The need for deer-proof equipment raises the cost and time required for regeneration attempts.
Impacts to road and human safety
Social impacts of feral deer include vehicle collisions and public fear of them. Deer also attract poachers, leading to trespassing, illegal firearm use, fence cutting, and disturbing residents. Land managers dealing with feral deer control report declines in their well-being and strained relationships with neighbours who neglect to control their deer.
In vegetation impact studies, the majority of thrashing by feral deer occurs along roadside verges. These findings indicate that deer utilise roads to traverse their range, with thrashed vegetation serving as a signal of their presence to other males in the vicinity.
Fast Fact:
Deer are the 4th most commonly hit animal in Australia, and the number of collisions is increasing each year.